#280: Sentiment Analysis With Bert of Goodreads Reviews
The star review we got back with Bert in last week’s post gave me an idea: how well does my written review of a book I read match the stars I gave that book? Let us use some Python code to answer this question.
Export reviews
To get something to check, we first need the reviews. On Goodreads.com we can go to My Books > Import/Export and export our entire library – that includes all the books we have read, but also everything we marked as want to read or put on a shelve. I did that and ended up with a CSV file with these columns:
- Book Id
- Title
- Author
- Author l-f
- Additional Authors
- ISBN
- ISBN13
- My Rating
- Average Rating
- Publisher
- Binding
- Number of Pages
- Year Published
- Original Publication Year
- Date Read
- Date Added
- Bookshelves
- Bookshelves with positions
- Exclusive Shelf
- My Review
- Spoiler
- Private Notes
- Read Count
- Owned Copies
Clean-up the data
Since we got everything in our library from Goodreads, we need a bit of clean-up before we can work with the data. We need to select the columns we are interested in and filter out all books we did not read, gave no stars or have an empty review:
The final step in this clean-up script writes out a new CSV file with the cleaned data. That way we do not need to repeat the clean-up step whenever we need to adjust the reporting.
Sentiment analysis
With our cleaned data we can create another script for the sentiment analysis. We need a bit of preparation code to initialise the pipeline and put the code for the sentiment analysis into a function named sentiment(). This function gets the written review as a parameter, analyses the sentiment and returns the star review as an integer. Since Bert can only work with sentences that are below 512 characters, we need to cut the longer reviews to that length.
We can now create a new column for our DataFrame that takes the written review and applies our function to it:
This code runs for a while, but at the end we write out yet another CSV file with the stars that match the sentiment of our review.
Play with the numbers
We now have a CSV file with the stars that match the written review and the stars I gave the book. We can read this file into our Python script and create a few graphs:
When we run the script, it produces us these 3 graphs:
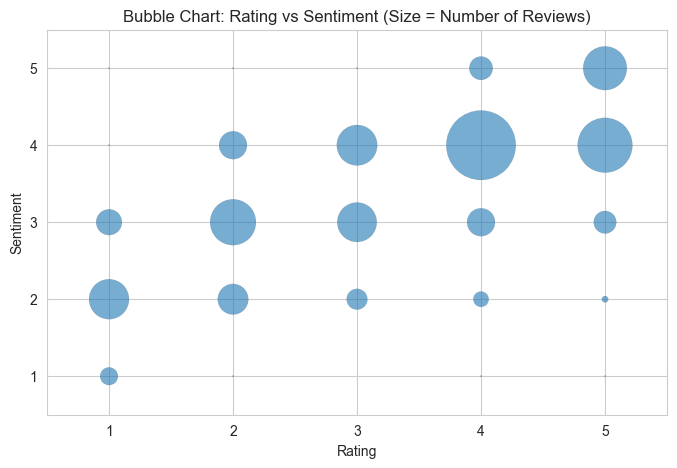
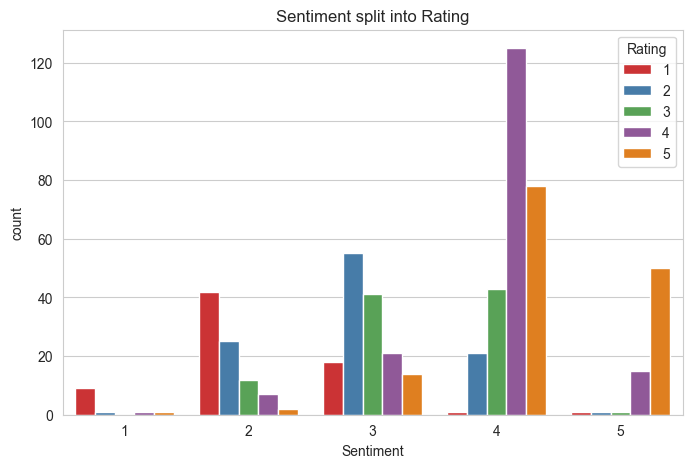
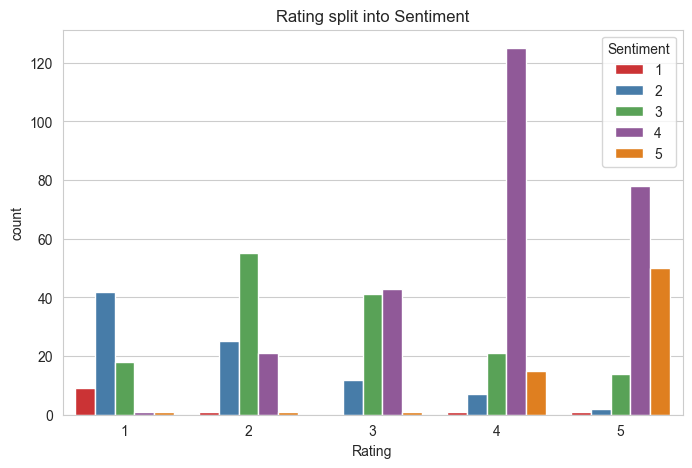
The first graph shows us a bubble chart with the circle in a (skewed) size of the books. We can see that for the 1- and 2-stars ratings, the largest number of books get a sentiment that is 1 star better than the rating. For the 3-stars rating we get nearly a tie between a 3- and a 4-stars sentiment. The 4-stars rating matches the 4-stars sentiment, while the 5-stars rating most often results in a 4-stars sentiment.
The two bar charts show the count of books and how the sentiment and rating split up. These two graphs are no longer skewed and let us see the tiny number of reviews that are far off.
Conclusion
This little experiment showed that my reviews and the stars I gave best match for 4-stars books. If I gave less stars, my review tends to be 1 star better, while the 5-stars books tend to end up with a 4-stars review. I often try to include positive aspects in a review, even if I dislike the book – and the numbers show that this is indeed the case.
While Bert can handle different languages, most libraries we may use cannot. Next week we figure out how we can detect the language of a sentence.