#173: Create Graphs with NetworkX
Today we make a small deviation from the plots of Matplotlib and work with networks and graphs (as in computer science). Having a structure that allows us to define objects and their relation to each other is not only interesting for theoretical problems. In this post we look at the basics and next week we put that knowledge into practical use.
Install NetworkX
NetworkX allows us to work with complex networks and analyse their structure. We can install it with this command:
If you want to get NumPy and SciPy with NetworkX, you can use this command instead:
Creating a graph
We can create a graph with the Graph() method:
This gives us an undirected graph, a graph in which the direction of an edge between two nodes does not matter.
Add nodes
We can add nodes one by one or in bulk:
NetworkX allows us to use any arbitrary (hashable) Python objects for our nodes – except None. That allows us to use strings with more useful names for our graphs:
We can ask the graph about the number of nodes and what nodes it has:
Add edges
We can connect the nodes with edges. As with nodes, we can add a single edge or add edges in bulk:
We can ask the graph about the number of edges and what edges exist:
Draw the graph
We can get the graphical representation of our graph with the draw() method:
As you can see from the import, NetworkX uses Matplotlib for its drawings. The code above draws our graph with a random location for the nodes and will look differently on each run:

If you want a representation that changes less, you can use the draw_circular() method:
This puts all nodes in a circle and draws the edges between them:
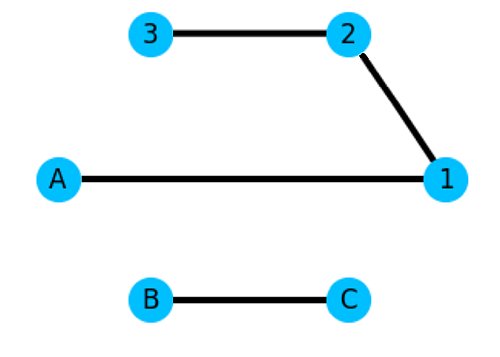
The order of the nodes may still vary, but at least the nodes are in an expected position.
Directed graphs
If we want to create a graph in which the direction of the edge matters, we can create a directed graph with the DiGraph() method:
Everything else stays the same, but now the order in which we place our nodes in the edges matters. We see the effect when we print our directed graph:

The nodes and the edges are the same as before, but now we have a little arrow head on the edge that shows in which direction the connection goes.
Next
With the basics of NetworkX we can create graphs and print them. Depending on the problem we have, we can create a directed or an undirected graph and add the nodes and edges to represent the data. Next week we use NetworkX to untangle project dependencies.